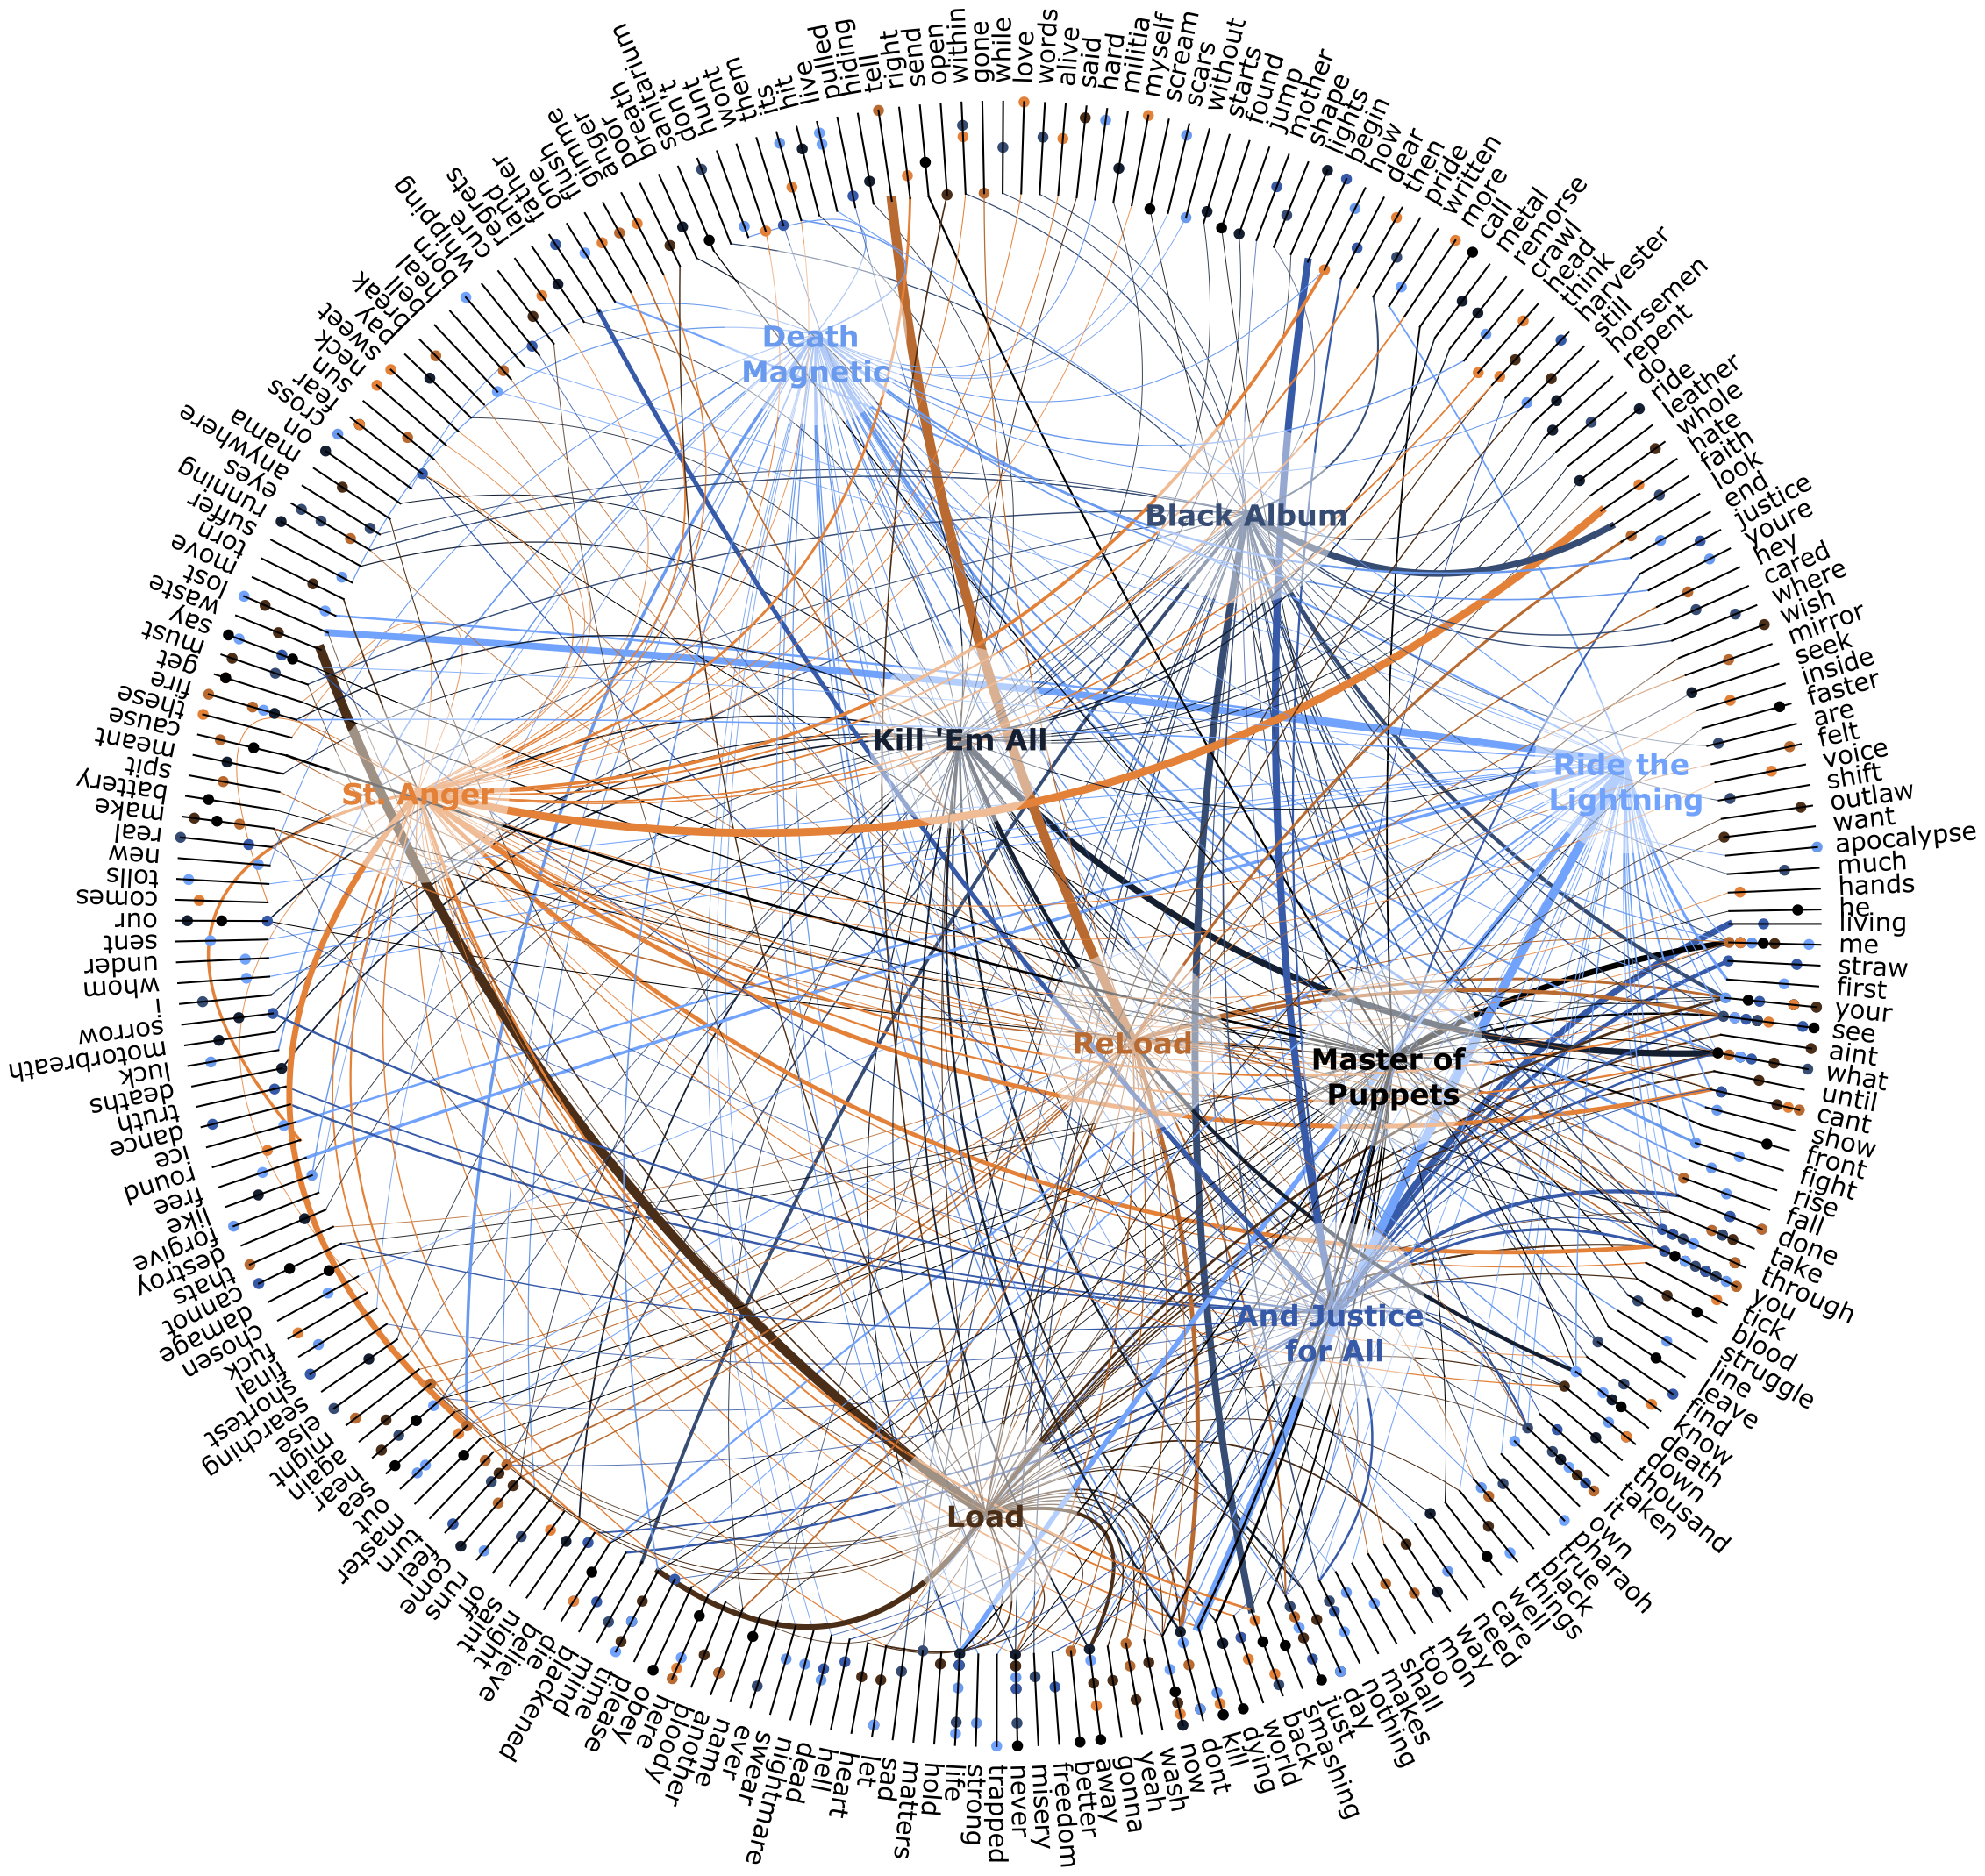
Data visualization can simply be defined as the technique that is used to present data in graphical or pictorial format. It can help decision makers to see analytics that is hidden within raw data and identify new patterns or grasp difficult concepts. In other words, data visualization technique helps people to display data in a graphical and clear manner in order to interpret or assimilate them quickly.

Data visualization is associated with a wide range of benefits as well as advantages. It has the potential to communicate information in graphical, concise or clear manner for the people in need. Almost all the companies that exist in the modern world have to deal with high amounts of raw data. This can slow down the business processes and increase the time taken to make decisions. However, data visualization can help the businesses to stay away from that hassle and make intelligent business decisions. In fact, data visualization helps the business owners to examine all the raw data in textual format such as spreadsheets and tables. It can be considered as one of the best options available out there for the managers to identify key trends and make right decisions accordingly.
With data visualization, you will be able to display large amounts of data in a convenient manner. In fact, the visual elements can be highlighted with graphs, gauges, maps, dials, charts, scorecards and dashboards. This can help individuals to identify key trends in data within a couple of seconds. It can lead them towards intelligent business decisions at the end of the day.
Data visualization is entirely imaginative. If you are a person who can visualize something in your mind, you can do it on the computer screen as well. For example, scientists might want to check the effectiveness of a specific drug that they propose for cancer patients through data visualization. Such a research is associated with a lot of raw data and it would consume a lot of time for them to analyze them without any visual technique. Data visualization tools can also help the young entrepreneurs to present their products or services on the internet in an informative and creative manner. Wherever you go, you will be able to find data visualization. In addition, data visualization can deliver answers to the doubts you have in your mind in a helpful way.

Data visualization can also be considered as a comprehensive technique. Almost all of us have ended up with poorly formatted presentations when we searched for something on the Internet. In some cases, people tend to represent complex information in an even more complex manner. The data visualization basics can help them to stay away from it and present data in the best possible manner so that others can understand without much difficulty. Information is recognized as the language of 21st Century and it is extremely important for all the people to have a better understanding on data visualization to experience all the benefits that are associated with it.

