5 Free Helpful Calculators Online

Years back, a calculation is done only with the use of electronic calculators. This portable device can perform calculations ranging from fundamental arithmetic to complex mathematics. But today, the cyberspace has brought simplicity to the use of calculation and anyone can perform simple or complex calculation online. In this review, we shall have a look at 5 free online calculators that are helpful in this contemporary age.

#1: PREGNANCY CALCULATOR

To estimate the schedule of a pregnancy, it is done with the use of a pregnancy calculator based on the due date that is provided. A sonogram is used to get an estimated due date, which can be acquired from a healthcare provider during prenatal care. When you calculate the pregnancy schedule with the due date, the calculator will tell you the exact age of the pregnancy. For instance, it will tell you if a pregnancy is 5 months 4 days old. It also tells you the length and weight of the baby. More so, the date when your baby was likely conceived and the percentage through the pregnancy.

calories calculator sheet

#2: CALORIE CALCULATOR

This calculator can be used for the estimated number of calories needed by an individual for his/her daily calories consumption. It also provides simple guidelines on how to gain or lose weight. Also, you can use the metric units’ tab if you prefer the International System of Units (SI Units). Furthermore, the calculator calculates in Basal Metabolic Rate (BMR) with results on an estimated average. The BMR is the quantity of daily expended energy at rest.

#3: HOURLY WEEKLY YEARLY WAGE CONVERSION CALCULATOR

This calculator stands out when you need to know the hourly, weekly or/and yearly conversion of your wages. It helps you to evaluate the amount you will be paid before the start of a job or at the end. Even if your job pays hourly, weekly, bi-weekly, semi-monthly, monthly, quarterly or annually? The hourly weekly yearly wage conversion calculator simplifies the entire evaluation process accordingly by generating the conversion of your wages separately (or as requested). This way, you’ll be able to make a good decision on how to manage your finance.

financial wage calculator image

#4: INFLATION CALCULATOR

Inflation, as globally known as the increase in the general price level of goods and services. Consequently, depreciating the value of the currency. Hence, the inflation calculator is available online to calculate the rate of inflation of a particular nation at a given time. There are three types of this calculator which are:

(a) Forward Flat Rate: It involves the calculation of a particular average inflation rate following few years.
(b) Backward Flat Rate: Based on a particular rate of average inflation, this calculator calculates equivalent amount of a purchasing power for some years ago.
(c) Historical Inflation Rate: this calculator can translate the Consumer Price Index (CPI) published in the United States into inflation rate.

#5: AGE CALCULATOR

Age calculator is simply available to determine ages or an interval between two dates. The result of the calculated age will be shown in years, months, weeks, up to seconds. The age calculator works on common global age system; as age grows from individual’s birth. The result is achieved by imputing the date of birth and the current date in the calculator. The calculator does the work of addition and subtraction to determine the current age of the person.

CONCLUSION

With the availability of these calculators online, you don’t need to go around with an electronic calculator anymore. Best of all, these calculators are free to use online.

4 Handy GOOGLE Analytics Plugins For WordPress

WordPress is a favorite, not only for me but for every other writer and blogger. It is truly a great platform to write, blog and shares your work with other people that do the same. WordPress is certainly not as fun without the plugins that make it truly one of the best platforms for bloggers. With the right plugins, WordPress can become something else. I’m going to be telling you four of the best WordPress plug-ins that specify with analytics and how they can impact you for the better.

1). Google Analytics plus- Google Analytics plus is a classic and a world’s favorite, it gets the job is done for you fast and easy with no difficulty. The best part about this plugin is that it is simple. Google Analytics plus is as simple as they come, it takes the process of getting your data and viewing it so easy to understand. With bar graphs and easily readable charts, these plugins fit quite easily on your dashboard. It also provides you with 100% creativity process and lets you customize it as much as you’d like.

2). Google Analytics WD Premium plugin– This plug-in is recommended in the premium version because with the free version this plugin is just like the rest of them, it gives you your stats and that’s it, it does what it’s supposed to do and if that’s all you are looking for then I suggest Google Analytics plus but if you want a little bit more then the Google Analytics WD Premium plug-in is for you. Apart from the stats and data this plugin also provides you with information about how you can track your website’s progress and how to manage it better.

3). Monster Insights– Monster insights is known for its spot on tracking method. This plugin will track your progress to the very core and send you raw and detailed data on it. It also helps you boost any website with e-commerce. E-commerce is very tricky to handle, especially when placed on websites and having a type of e-commerce on your website means you have an online store or even a link to a store. Monster Insights tracks your e-commerce for you.

GA WD WP

4). Google Analytics counter– Lastly, Google Analytics Counter. This plugin is on this list because it does one specific thing. It tracks your links. Whether your WordPress website is a blog or a store there is no way you can avoid linking other websites or stores and you can even do this for profit. In a case of profit, Google analytics counter makes sure to track how many clicks that link is getting and that will sure profit you.

google analytics counter pic

That is all for these wonderful plugins you might be favoring one or the other because it gets exactly what you want to be done and that’s why I was sure to include their specific tasks. Nevertheless, all of these plugins are truly magnificent and they are the best when we talk about handy google analytics plugins for WordPress.

Top 5 Product Review Aggregator Websites on the Rise

A review aggregator is a system which collects reviews of products and services (such as films, home appliance, books, software, hardware and cars). This system stores the reviews and uses them for purposes such as supporting a website where users can view the reviews, selling information to third parties about consumer tendencies, and creating databases for companies to learn about their actual and potential customers.

As a consumer, you will need reviews and other customers experience before you can decide on which product to buy. Below are the top 5 best review aggregator website.

  1. Bestrater.com is one of the best review aggregator website online which comes with many features that can help you choose/buy a quality product on the net. This site collects reviews from sources like amazon based on user experience, and shows them in simple interface. There are several categories when you scroll down the web page. Bestraters ratings are always up to date and you can find pros and cons sections for every product you search (which makes it arguably the best).star rating
  2. Wize aggregates reviews across all products; whether its electronics, home and garden, video games, health products etc. This review aggregator website searches shopping sites with user reviews like Shopping.com and Amazon, and expert reviews from traditional product review sites. The company has 700,000 product reviews from different websites. Wize quantifies what percentage of reviews were positive or negative and it tracks buzz – by simply counting what percentage of reviews for a product were posted in the last 60 days and how the reviews rated that product relative to others in its class.product review aggregator
  1. Retrevo. This review website discovers product manuals and previews them if in PDF format, displays information from manufacturer websites, searches blogs and forums, professional reviews and articles and offers a preview pane to easily switch between sources. Retrevo doesn’t offer numerical ratings, saved searches or much else. The varieties of sources searched are very good, but not much value added on top of that. For a simple, powerful, thorough search – Retrevo is a good option.
  2. Testfreaks is a gadget review website that comes with many nice features that can help you choose a better product online. It collects user reviews from thousands of sources and shows them in simple interface. There are numerous categories on the website’s sidebar. You can find categories for home audio, computers, games, cameras and camcorders and many more.You can make use of the search box available at the top of the website to quickly find the product you are looking for. There is a profile page for each gadget. It consists of lots of information on different gadgets and various ratings for them (user score, expert score, design etc.).
  1. DigitalAdvisor rate products based solely on user reviews from around the Web. The site has its own community reviewing products as well and has launched a feature where users can ask each other for advice on particular products or categories. All of these sites will help you find reviews of electronics and other products and each of them has a unique feature set that adds value to the basic search and aggregation.

Brief Overview of Online Keyword Research Tools

Keyword research is the base of any SEO, PPC, and content marketing campaign. Every search people do is an expression of what they need, want, desire, or have interest.

Choosing the right keywords allows you to deliver the right content to the right audience. When you do a good job choosing your keywords, you’ll have more traffic, more leads, more customers, and ultimately, make more money.

There are many online keywords research tools, both free and paid. They will help you to find which keywords you should target and well as they will show you how competitive they are.

When you’re thinking about keyword research tools, you automatically think about Google Keyword Planner . Since 2013, if you want to use this tool, you need to create an Adwords account. But this is just a minor disadvantage compared to the information you can retrieve. The biggest advantages when you’re using Google Keyword Planner are:

* you can see the trends;
* does a great job examining the search volume
* you can enter on your competitor’s landing pages and see their high volume relevant keywords.

But there are other online keyword research tools that have some unique features to help you target the right audience for your website.

* SEMRush

This is a great tool to find keywords. It gives you an estimated traffic data as well as the keyword difficulty scores.

Semrush dashboard

One feature that puts SEMRush aside from its competitors is that it allows you to check both the keywords your organic competitors are using, as well as to discover which keywords they are bidding on. This is a great source of information because if your competitors are willing to pay for a specific keyword, it’s because they’re having traffic or sales from it. So, you can put a little more effort and try to attack the keyword organically.

* Ubersuggest and KeywordTool.io 

These two online keyword research tools are very similar, Their goal is to provide you with a wide variety of long tail keywords that usually Google Keyword Planner doesn’t show you.

You can either expand your keywords list, or you can also use any of this tools to find variations of your long tail keywords to use on your articles or blog posts.

Although BuzzSumo can’t be considered an online keyword research tool in itself, you should use it. When you already decided about the keywords you want to use, you can check BuzzSumo and look for ideas for your article or blog post.

There may be many online keyword research tools, but it all starts with common sense. Try to think as if you wanted to buy your product or service, as if you had the need you’re fulfilling with your article your blog post. Try to think as your targeted audience and come up with keywords that you would search for by yourself. This will give you a great starting point.

Do You Need Business Intelligence Tools?

In the old times, it was common to see the marketing manager evaluating the different marketing campaigns performance, the vice president of sales checking the sales that were made, and the chief financial officer just analyzing the KPIs (key performance indicators).

But with the amount of different data that comes from the most diverse places, it’s just impossible to do it the same way. Nowadays, companies get data directly from inside such as prospects, clients, partners, and suppliers. But they also get loads of data from external sources like social media channels, marketing data services, among others. So, companies need business intelligence tools to not only monitor all the data but also to get crucial insights that will allow their businesses to grow. There are 4 main advantages of using business intelligence tools:

* they allow business owners to make decisions based on facts and not on older employees intuition;

* they help business owners improving the overall performance of the company;

* they will help business owners improving the business process by using the right visualizations;

* they will easily monitor and report the key performance indicators.

There are many different business intelligence tools to choose from. Since businesses are constantly evolving and need to handle more and more data, the business intelligence tools market also needs to keep evolving and innovating to meet the needs of the different businesses, from all sizes and from all industries.

Business intelligence tools can then be divided into 3 main categories:

#1: Guided Analysis & Reporting:

In the old days, this would be just like the predefined reports businesses used. Now, companies can not only see those static reports but they can interact with them as well. Features like filtering, selecting, comparing and visualizing different sets of data are now possible. And this is only due to the business intelligence tools that have been evolving.

You can then analyze the data using reports, scorecards, and dashboards.

#2: Self-Service & Analysis:

This category includes the analysis of ad hoc data. This way, companies can use this reporting and analysis at any time they want, without needing any IT assistance.

You can then analyze the data using data visualisation, ad-hoc reporting and analysis, data discovery and OLAP (online analytical processing).

#3: Advanced Analytics:

This category includes the business intelligence tools that allow data scientists to create predictive analytical models. They spend most of their time gathering, importing and processing the data. There are several tools used here such as data mining, statistical modeling, predictive analysis and big data analytics software.

In order to grow your business, you don’t just need data. You need to know how you can use the data to make better management decisions. These can affect your products, services, your relationships with your clients, prospects, partners, and suppliers. By using the different business intelligence tools, you’ll have a deeper understanding on how your company is operating and also get some ideas on how you can improve.

Breathtaking Data Visualizations

Data visualization is extremely important for modern world business owners to run their businesses in a smooth manner. In fact, data visualization is linked with almost all the aspects of human activities. In other words, data visualizations have the ability to deliver meaningful information to the people in many fields such as marketing, business, and research and product popularization.

Data visualization can be done in many different ways. Bar charts hold a prominent place out of them. In fact, bar charts can be used to convey information in an effective manner. Bar charts can be combined with other types of charts and graphs such as pie charts and bar graphs. Even school kids learn about bar charts at school and nobody will find it as a hard task to identify the information hidden behind a bar chart. When it comes to data visualization, bar charts are being used to create informational displays and reach any type of audience.

The interactive maps have also received a lot of attention in data visualization. An interactive map can be used to display information in many different levels. This is also known as drilling down. Interactive maps are being used by many community programs, government and business organizations because of their effectiveness. For example, almost all the airlines offer interactive maps of their plane interior to help people choose their own seat. Interactive maps are also being used to learn about a specific area.

interactive data visualization

Business owners have to deal with a lot of data and data mapping has become a frustration to them.

Data visualization has the potential to keep them away from that frustration. That’s because information such as geographical data and research data can effectively be conveyed through this technique. In other words, data can be displayed in a simple manner through data visualization. Data mapping can sometimes contain visual diagrams of different departments of your business. Data visualization can be used with business mapping as well and you don’t need to worry about anything.

dashboard example

For example, data visualization can be used to create a department map for the shipping department of a specific business. The data visualization technique would offer real time information that can be useful in inventory management.

The flash technology is now being used along with data visualization in order to experience the best results. The flash maps, flash graphs and flash charts deliver information whenever they are needed. Data visualization can facilitate flash graphs and you will be able to present data in a manageable manner. The data visualization technique has also helped people who have certain disabilities. This fact is proven from the 508 Compliance, where people have got the opportunity to access useful public and government information regardless of their disabilities. Therefore, data visualization has delivered a new level of simplicity to complicated data. Any business owner who doesn’t like to go through the hassle of complicated data can think of adopting data visualization without any doubt on mind.


Top 3 business intelligence tools

The modern world businesses have to deal with a lot of data than ever. As a result, they face a variety of challenges when collecting and analyzing business information. That’s where business intelligence tools come into play. Business intelligence tools have the ability to help all the business decision makers to access data that they want with less hassle and quickly analyze them to identify available opportunities. However, you need to get in touch with a reliable business intelligence tool in order to experience all the benefits that are associated with it. Here is a list of the top 3 business intelligence tools that you can find out there on the Internet.

Tableau  was created with the objective of helping people observe and identify their data. All types of companies and business users can think about using Tableau to make their lives easy. The simple drag and drop features, innovative visualizations and reports, and delivery of critical insights across the company have contributed a lot towards its popularity. In addition, you can easily access and analyze all the key data through this tool. Tableau consists of three main sub products, which can be run on different platforms. The desktop version can be installed on a personal computer to collect and correlate dispersed data. Then you will be able to identify reports and create innovative reports. The server side application of Tableau can help the users to share information and critical insights through comprehensive dashboards. On the other hand, the online version of Tableau can be hosted on a server and save a lot of money that was meant to be spent on hardware.

Tableau dashboard

Board can be considered as a combination of corporate performance management and business intelligence. It has the ability to collect data from a variety of sources, store them and deliver to the users when they are in need for analysis. This tool consists of several impressive functions such as reporting, ad hoc querying, multi-dimensional analysis, and performance planning. It can also help the business users to engage with profitability analysis without any hassle. The job specific solutions that are delivered by Board have contributed a lot towards its popularity. This tool can be used across all the functions of an organization.

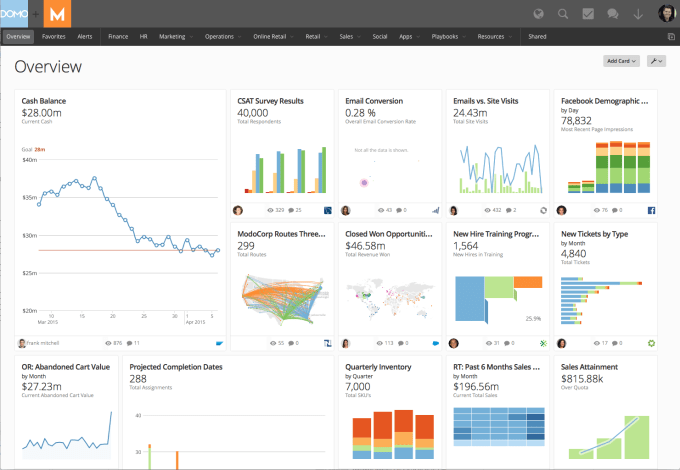
Domo is the first ever business management platform that allows users to access analytics and reports from a single platform. Business users who use this tool don’t need to have any technical expertise to get the best out of it. You will also get the opportunity to better business decisions with the information that you obtain from Domo. One of the unique features that you can see in Domo is its ability to access data located anywhere at any time. In addition, this business intelligence tool offers a variety of customized solutions to different business users such as sales, marketing, IT, finance and even the CEO.

domo sample

Different Ways of Visualizing Data

Visualizing data is becoming more important every day since we are not only exposed to a lot more data as the data itself is becoming more complex. It is frequently seen as visual communication because we present all the data in spreadsheets and reports, using charts and graphs. You can also see this data displayed in different forms such as infographics, maps, and heat maps. This will allow us to search for patterns and recognize any trends and correlations we might not see if we were only looking at a text.data visualization

Why visualizing data matters?

Not all visualizations will help you. Even if you have a trained eye to look at charts or graphs, the difference is that when you are using data visualization, you are looking for something new, some pattern that you didn’t notice before, some trend, and obviously, the way they relate.

One of the things that make visualizing data so interesting is that two individuals may look at the same data and one sees one thing and the other notices a completely different thing.

Usually, the bigger the data, the more information it will provide you.

To be able to visualize data and to look for patterns, trends and how they related to each other, you need to convert the text-based data into charts, graphs, infographics, maps, heat maps, among others. The problem is that the volume of data may be huge and you actually need specific tools just to visualize it. Below you can find 10 different data visualization tools that can help you, depending on your requisites to present the data as well as the amount of data you need to use.

* One of the latest trends you see on websites is the mapping tool. It mainly serves to show your visitors where you can find the company and to get directions or coordinates. Leaflet is just one of the many companies that have a mobile-friendly interactive map. It has many features from allowing you to zoom in and out, keyboard navigation, and you can also define some specific locations. This kind of data visualization tools are particularly helpful for local businesses who also have a website. When their visitors look at the map, they will know exactly where the business is located and which direction they should take to get there.

* If you or your company deal with a lot of data, the best way to analyze it is by using charts. FusionCharts is a complete package that offers you near 100 charts and gauges and almost 1,000 data-driven maps. They have pretty amazing features that will look pretty good on your reports. You can use FusionCharts for online reports as well as you can download them to different formats and also present a written report with their amazing charts included.

* Google Charts is a great tool to visualizing data. They have many different types of charts, and all of them are interactive. They offer from geo charts to timelines or gauges, and they still give you the chance to use the most common types of charts as histograms, pie charts, or bar charts.

Google chart example

* If you’re looking for a hosted solution to include compelling charts on your website, iCharts  may be a good option. Their charts are completely customizable and you can adjust the colors you want to use to match your website. One of the greatest advantages of iCharts is that you can import the data from Excel spreadsheets, Google docs, and others.

* We started seeing Timelines only on Facebook. But now, it’s becoming more used when you need to display a series of events, in a chronological manner. Timeline (http://timeline.knightlab.com/) is one of the easiest data visualization tools you can use; you only need a Google spreadsheet where you format all the data you want to display and use Timeline to publish it.

timeline data visualization

* Ember Charts (http://opensource.addepar.com/ember-charts/#/overview) is another popular tool when it comes to visualizing. They come with time series, scatter and pie charts and they are very customizable. One of the things that put them apart is that you can have automatic resizing and labels.

* Gephi (https://gephi.org/) is one of the leading data visualization tools. It allows you to use large data sets and still get amazing visualizations, as you can also use it to sort and clean the data.

* When you are looking for some personalized and distinct visualization tool, Axiis (http://www.axiis.org/) may be a good option. Although they provide pre-built visualization components, you can also use abstract patterns and this way you’ll get a unique visualization of the data you want to display.

* Getting your own infographics is now easier thanks to Infogram (https://infogr.am/). With Infogram, you can have your own infographic in 3 simple steps: just pick from one of their templates, visualize the data by adding maps, videos, charts (more than 30 chart types), images and more, and hit the publish button. One of their best features is that they allow you to use real-time data.

* Plotly (https://plot.ly/) is another visualization tool that has their charts and graphs built-in with social sharing features. It’s extremely simple to use: you just need to gather your data and customize the look and feel of your charts and graphs.

And the list goes on and on. There are many data visualization applications you can use. It really depends on the data you need to visualize, the amount of data and how you want it to be displayed. You’ve seen here examples of data visualization tools that just allow you to create the simplest charts or graphs to the most advanced ones that allow you to use real-time data and make the visualization exactly as you want.

Data visualization is crucial as well as to use the best data visualization tools. This is how you notice how things, in general, are evolving, and how many small things are related to each other.